
AMR business-case guide
How to Calculate AMR ROI: Labor, Throughput, Downtime, Integration and Payback
Build a defensible AMR business case from a measured baseline, complete project costs, accepted benefits and explicit uncertainty.
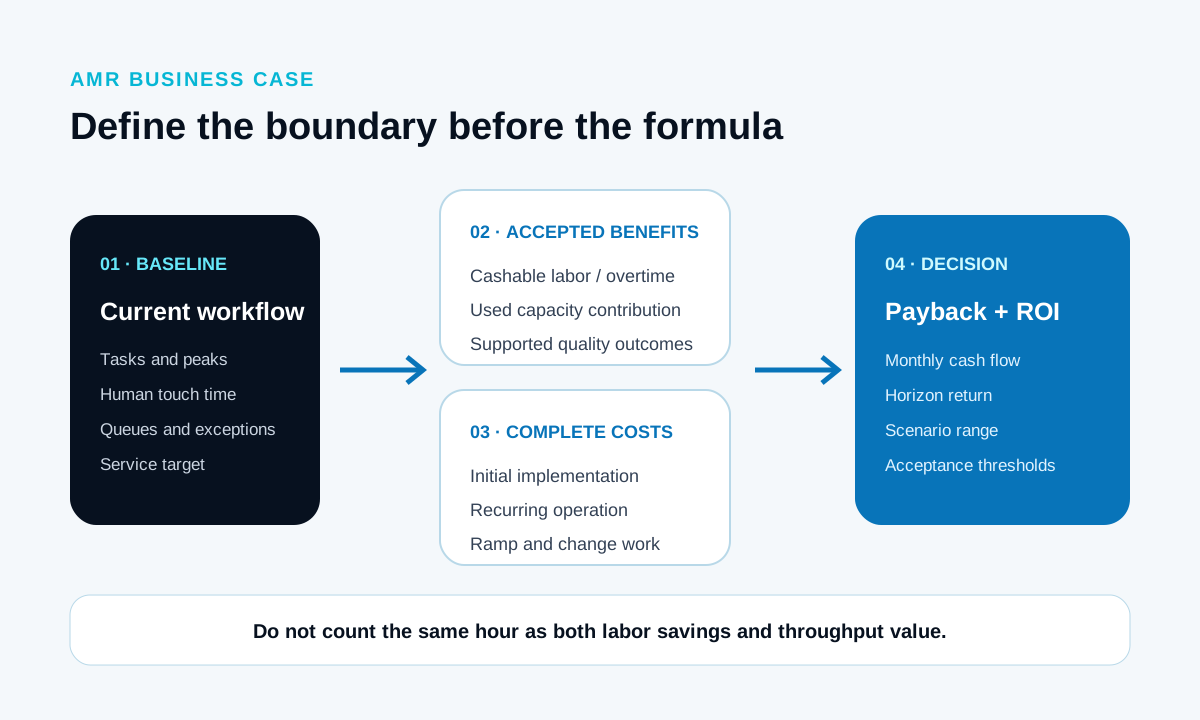
To calculate AMR ROI, measure the current workflow, separate cashable labor and overtime changes from redeployed capacity, add only throughput or quality value the operation can realize, subtract recurring costs, and compare the net benefit with the full implementation cost. The equations are simple; defining each input without double counting is the real work.
Decision boundary
Start with the decision, period, and current workflow
State whether you are funding a pilot, releasing a first production workflow, expanding a fleet, or comparing AMR with another design. Choose a planning horizon and keep payback separate from multi-year ROI. Finance should own tax, depreciation, financing and discount-rate treatment.
Measure representative normal, busy and disrupted periods. Record tasks by interval, loaded and empty travel, pickup and drop-off, waiting, handoff confirmation, staffing by shift, overtime, queue time, missed moves, exception frequency and recovery work. Use the same workflow boundary for current and proposed states.
| Input | Measure now | Why it changes the model |
|---|---|---|
| Demand | Tasks by 15- or 30-minute interval, peaks, due times | A daily average can hide the busiest sustained period. |
| Complete cycle | Travel, handoffs, queueing, confirmation, recovery | Brochure speed excludes much of the task. |
| Labor | People, paid hours, overtime, benefits, supervision | Wage alone understates cost; not every released minute is cashable. |
| Exceptions | Blocked routes, missing loads, failed handoffs, recovery | Exceptions consume people and reduce productive robot time. |
| Service | On-time completion, queue limit, downtime tolerance | The business case must buy an agreed operating result. |
Use the AMR fleet-size calculation guide when demand, complete cycle time, charging and productive robot-hours still need to be modeled.
Benefit model
Separate cashable benefits from redeployed capacity
A cashable labor benefit requires an approved action: avoided overtime, fewer contractor hours, an unfilled vacancy, avoided future hiring or a documented staffing change. If a person keeps the same paid hours and uses released time for another task, record it as redeployed capacity until finance approves a value.
Use loaded employer cost, not wage alone. The U.S. Bureau of Labor Statistics includes wages and benefits in employer compensation. Its March 2026 private-industry average was $32.60 in wages plus $14.01 in benefits per hour. Those national numbers are context, not a project input; use the site’s payroll, benefits, premiums, overtime and contractor rates.
Annual cashable labor benefit = changed paid hours × approved loaded hourly cost.
Value throughput only when the operation can use it
If the workflow removes a line-starvation constraint, supports additional shipments or postpones an expansion, document the causal link and use the contribution method approved by finance. Keep additional physical capacity, expected utilized capacity and accepted financial contribution visible. Revenue is not benefit unless costs, demand and the actual constraint are considered.
Use records for quality and damage; do not invent safety dollars
Use historical first-party records for rehandling, material damage, inventory errors or expedited recovery. Define which event the new workflow can change and verify it in the pilot. ISO 3691-4:2023 covers safety requirements and verification for driverless industrial trucks and their systems, including AMRs. Safety belongs in design and acceptance; any risk-cost model needs qualified safety, insurance, legal and finance ownership.
Cost boundary
Include implementation, recurring operation, and internal ownership
Initial investment includes more than robot hardware: AMRs, top modules, carriers, chargers, fleet software setup, mapping, interfaces, network work, doors or lifts, site changes, safety work, validation, training, launch support, internal project time, spares and a stated contingency. Separate included, optional, customer-provided and excluded items.
Recurring annual cost may include subscriptions, support, maintenance, spares, batteries, energy, network or cloud services, inspections, retraining, internal system ownership and planned change work. Record whether each cost scales by robot, site, workflow, user, transaction or contract term.
Use the AMR cost guide to normalize the proposal scope. The ROI worksheet should consume that complete cost boundary instead of creating a cheaper incomplete total.
Calculation
Calculate net benefit, simple payback, and horizon ROI
Annual net benefit = cashable annual benefits + accepted annual capacity contribution − recurring annual operating cost
Monthly net benefit = annual net benefit ÷ 12
Simple payback months = initial implementation cost ÷ monthly net benefit
Horizon ROI = (total accepted benefits − total costs) ÷ total costs × 100
Payback is undefined when net benefit is zero or negative. When benefits ramp, calculate cumulative monthly cash flow instead of dividing by a steady-state month. Total costs must include initial investment and recurring costs over the same horizon. Add the organization’s finance rules rather than presenting simple ROI as net present value.
Worked example
Make every number visibly hypothetical and editable
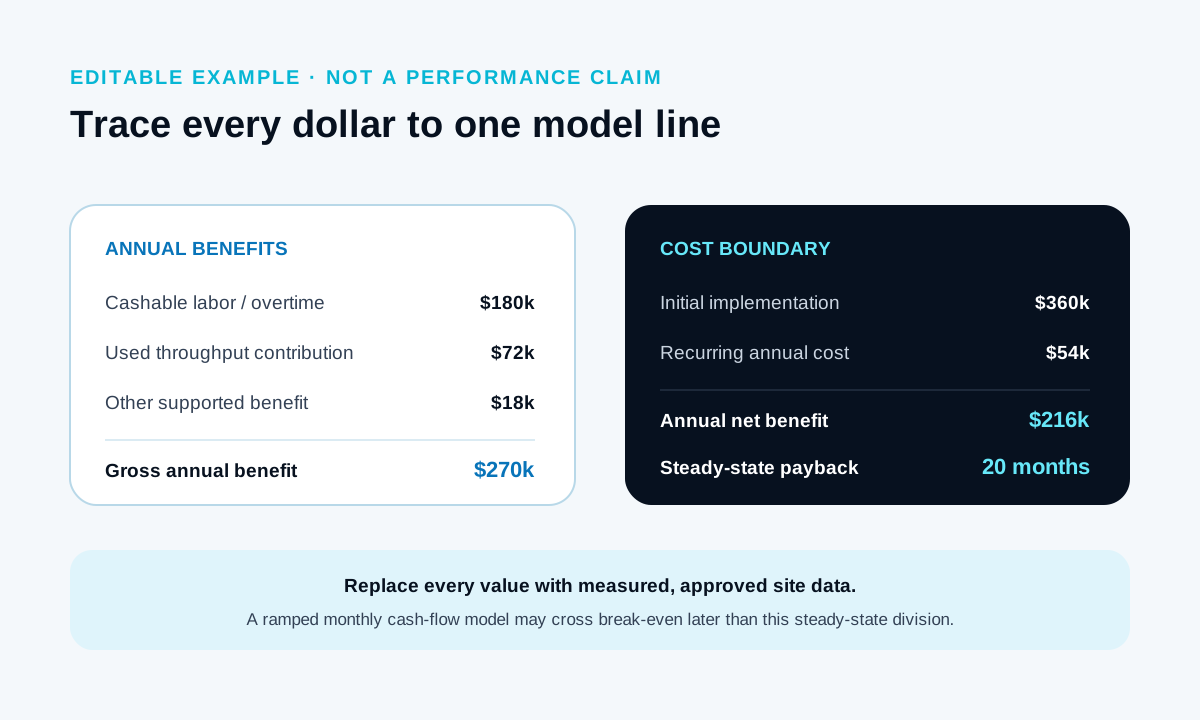
This example demonstrates the math. It is not a HiO customer result or performance promise. Replace every value with measured and approved site data.
| Model line | Hypothetical base case | Calculation note |
|---|---|---|
| Initial implementation | $360,000 | Hardware, integration, site, validation, training, internal time and contingency |
| Annual cashable labor/overtime benefit | $180,000 | Only hours tied to an approved staffing or overtime action |
| Annual accepted throughput contribution | $72,000 | Capacity the operation expects to use, valued by finance |
| Other accepted annual benefit | $18,000 | Supported by historical first-party records |
| Recurring annual cost | $54,000 | Software, support, maintenance, spares, energy and internal ownership |
| Annual net benefit | $216,000 | $180,000 + $72,000 + $18,000 − $54,000 |
| Steady-state payback | 20 months | $360,000 ÷ ($216,000 ÷ 12) |
| Three-year simple ROI | 55% | ($810,000 cumulative benefit − $522,000 cumulative cost) ÷ $522,000 |
The 20-month division is steady-state payback. If deployment and ramp consume six months, actual cumulative break-even occurs later. Apply monthly benefits and costs to the cash-flow model.
Uncertainty
Model downtime, charging, ramp, and exceptions explicitly
Availability is the share of scheduled time when a robot can perform assigned work under accepted conditions. It is not hardware uptime alone. Charging queues, planned maintenance, blocked routes, interface outages, map changes, failed handoffs, manual recovery and unavailable operators can all reduce productive service.
Tie availability to output. A fleet can be available yet queue at one workstation. Record completed on-time tasks, queue percentiles, exception recovery, charger occupancy and bottleneck utilization alongside robot availability. Build a monthly ramp curve and replace assumptions with pilot and launch data as soon as it exists.
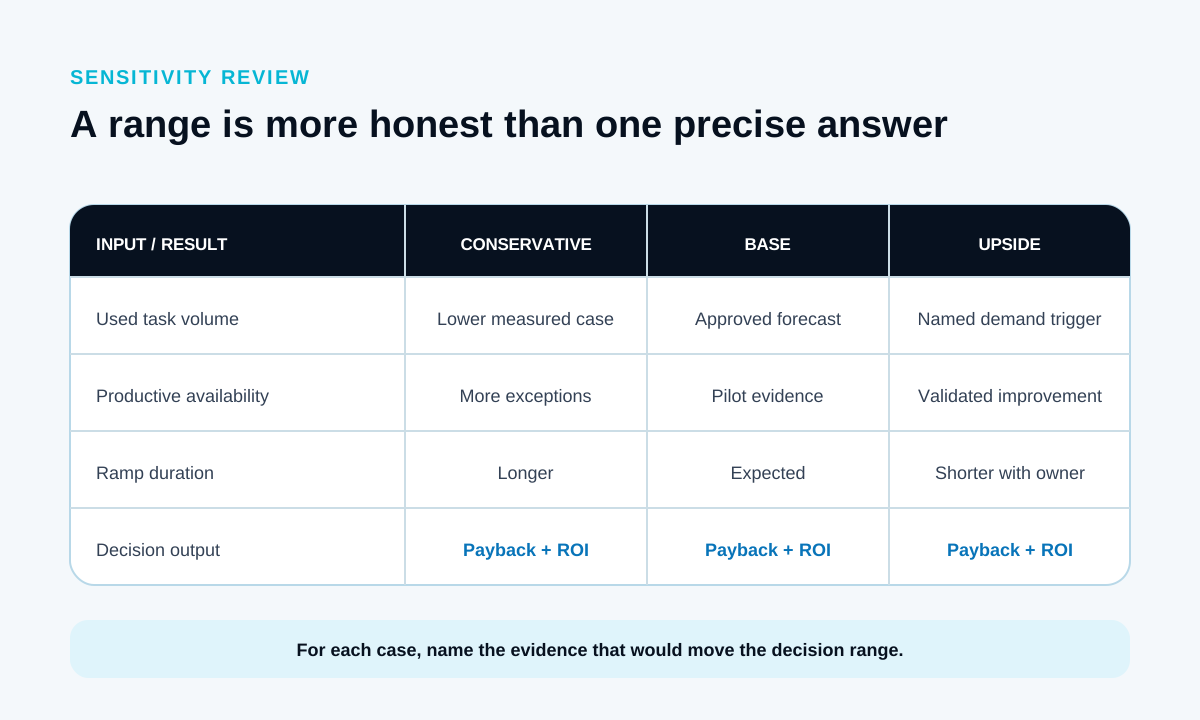
Run conservative, base, and upside cases
Change only inputs with a real basis: utilized task volume, complete cycle time, productive availability, exception rate, ramp duration, cashable labor action, realized contribution, support and change cost. For each case, show payback, horizon ROI, service target and the most sensitive assumption. Then name the evidence that would narrow the range.
Evidence loop
Turn the model into a pilot acceptance plan, then reforecast
The pilot should test the assumptions that matter most. Freeze the workflow, payload, route, handoffs, map, software, demand profile, observers and measurement method. Include normal, peak and degraded conditions: blocked route, missed handoff, low battery, unavailable robot and network or interface interruption.
Measure completed tasks, on-time percentage, cycle distribution, queue time, productive availability, charging, exceptions, recovery labor, human touch time and the bottleneck resource. NIST’s mobile-manipulator performance work illustrates why standardized test methods and quantified uncertainty improve comparison; it is not an AMR ROI formula, but the measurement principle applies.
Use a site-specific integration and pilot plan, and apply the published AMR safety checklist for the separate safety work. A pilot passes the business-case gate only when measured results support the approved scenario—not merely when robots move during a demonstration.
Reforecast after launch. Keep an assumption register with value, owner, evidence, confidence, sensitivity and review date. If released time is redeployed, report the capacity outcome instead of preserving a labor-savings line that did not occur.
Buyer questions
FAQs
What is the basic AMR ROI formula?
Over a defined horizon, ROI equals cumulative accepted benefits minus cumulative costs, divided by cumulative costs, multiplied by 100. Simple payback months equals initial implementation cost divided by monthly net benefit. Use monthly cash flow when ramp and timing matter.
What should count as labor savings?
Count cashable changes such as approved overtime reduction, contractor reduction, avoided hiring, vacancy handling or staffing change. Keep hours redeployed to other work in a separate capacity line unless finance approves a defensible monetary value.
How do downtime and charging affect AMR ROI?
They reduce productive availability and can change fleet size, completed tasks, support labor and recurring cost. Model charger capacity, maintenance, blocked routes, interface interruptions, exception recovery and the service target—not only robot hardware uptime.
What is a good AMR payback period?
There is no universal good period. The acceptable threshold depends on capital policy, project risk, asset life, alternative uses of funds and benefit confidence. Compare the result with the organization's hurdle and show sensitivity.
Should safety benefits be assigned a dollar value?
Not by default. Safety design and verification are required project scope. Monetize risk changes only with approved first-party loss data and qualified safety, insurance, legal and finance review; otherwise keep safety as a non-negotiable acceptance gate.
Sources
Build the model from your workflow
Prepare task volumes, payloads, routes, handoffs, staffing and overtime, integration scope, service target and project horizon. The first useful output is an assumption table and pilot measurement plan—not a guaranteed payback number.
Discuss your workflow